Student Voting Participation Higher Than Previously Reported, Says Professor
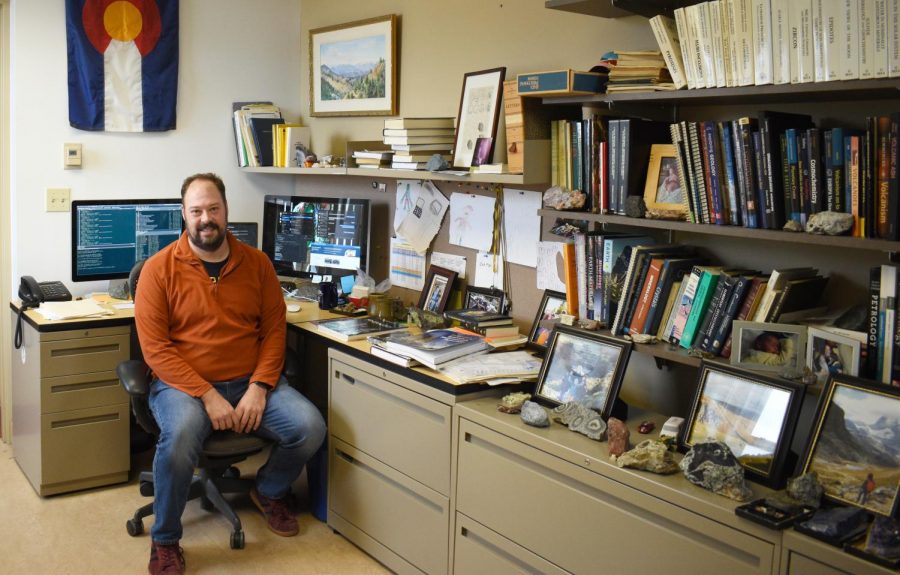
Associate Professor and Chair of Geology Zeb Page in his office. Page wrote a program to reconcile local student voting engagement numbers against data from the National Study of Learning, Voting, and Engagement.
Since 2012, reports generated by the National Study of Learning, Voting, and Engagement have calculated voter participation at Oberlin College as below national averages for college students across the country. Now, independent research undertaken by Associate Professor and Chair of Geology F. Zeb Page reveals that the NSLVE numbers may be inaccurate.
Page was initially motivated to examine the NSLVE numbers because of a hunch.
“When we look at [low turnout numbers], we imagine our student body to be more engaged than this,” he said. “I think that that’s because we actually are.”
Page decided to pull the Lorain County voter file and write a program to match internal student data — specifically names and birthdates — with county registration and voting records for the 2012, 2014, 2016, and 2018 general elections.
“You have a high certainty that those matches are accurate,” Page said of the 2018 numbers. “It’s [based on] first name, last name, year of birth, month of birth, date of birth.”
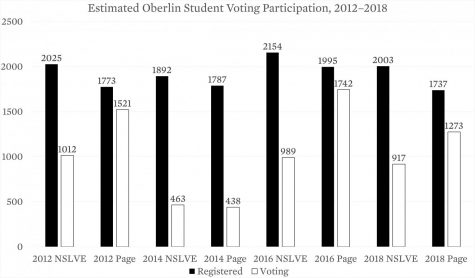
Page’s program located 1,737 students who were registered to vote in the 2018 general election in Lorain County alone. Of those students, he found 1,273 who cast a ballot in the county — a 73 percent turnout of locally-registered students.
Oberlin’s NSLVE report for the same election painted a very different picture. The report located 2,003 Oberlin students registered nationwide, not just in Lorain County. Of those, the report estimated that 917 voted — a voting rate of 45 percent for registered students.
“I’ve got 1,273 ballots by Obies cast in Oberlin [in] 2018, and they’ve got 917 nationwide,” Page said. “The fact that I’m actually counting more votes in Lorain County than they’re counting nationwide suggests that NSLVE’s current method is undercounting Obie voters in Lorain County.”
NSLVE is an initiative of the Institute for Democracy and Higher Education at Tufts University, with the goal of charting voter participation on college and university campuses across the country.
“It began as an ambitious project,” said Dave Brinker, a senior researcher at the IDHE. “It wasn’t clear how feasible it was at all in the beginning.”
Brinker explained that almost all campuses with students who receive some kind of federal assistance in paying for school — through financial aid or loans, for example — submit their enrollment data to the National Student Clearinghouse, because doing so makes compliance with federal law much easier. According to the NSC’s website, their work is “designed to facilitate compliance with the Family Educational Rights and Privacy Act, The Higher Education Act, and other applicable laws.”
The NSC also oversees a research branch that works with educational institutions, including colleges and universities, to facilitate better decision-making by educational leaders. It’s this branch that Brinker and other researchers coordinate with to generate the biennial NSLVE report.
“Our process starts with colleges and universities signing up for NSLVE,” Brinker said. “And what participating really means is that they authorize the National Student Clearinghouse to use the records that they already submit. … If they authorize that, what happens is the Clearinghouse uses a third party vendor to match those enrollment records to public voter files.”
Next, the Clearinghouse sends the NSLVE team a “de-identified dataset with the student-level records but with no personally identifying information,” according to Brinker. The researchers then package the numbers into campus-specific reports and send them to the individual at each college and university who oversees institutional or internal research. At Oberlin, that person is Ross Peacock, assistant vice president for institutional research and planning.
Peacock said that, after consultation with the College’s senior leadership, he decided to participate in the NSLVE study to get some concrete data about political engagement on campus.
“Oberlin students tend to be engaged,” Peacock said. “Well, here’s a measure of civic engagement — let’s see how we do there from an [institutional research] perspective. That was my interest.”
When the numbers started coming back, Peacock was surprised by what they seemed to reflect — that Oberlin students were voting at much lower rates than this campus’ reputation for political engagement would suggest. He’s glad that Page decided to take a closer look at local numbers.
“Thank goodness, because some of our rates [appear] ridiculously low, even in 2016,” Peacock said.
In 2016, Oberlin’s NSLVE report indicated that, nationwide, 2,154 students registered to vote but only 989 did. That 46 percent turnout rate for all registered Oberlin students is much lower than Page’s estimate of 87 percent. Further, Page found record of 1,742 students who voted just in Lorain County in that election — almost twice NSLVE’s national figure.
College fourth-year Ezra Andres-Tysch was a first-year during the 2016 general election, and a dedicated volunteer for Hillary Clinton’s campaign office in Oberlin. He saw students being energized on Election Day, and turning out to vote — suggesting a greater degree of participation than reported by the NSLVE.
“I feel like everyone that was eligible had a plan,” Andres-Tysch said. “They had registered with someone. They reached out. Oberlin doesn’t have the best voting culture in the world, but 2016 was probably the height of [student participation].”
Brinker said that he has no reason to doubt the accuracy of Page’s numbers, and that discrepancies in the NSLVE data — at Oberlin and elsewhere — could arise for a number of reasons.
“We have two major potential places where we think we can improve our process,” Brinker said. “The first is in how registrars submit their data to the Clearinghouse. Our processes [require that] the campus has submitted complete records for the Clearinghouse, and that’s not always the case. … I’m not saying that that’s a problem at Oberlin. … The other place that we can have a problem is in … matching the student enrollment record to the voting records.”
Brinker also cited the fact that Oberlin is a highly “mobile” campus — meaning that most students don’t come from Lorain County — as a potential challenge in the data matching process. He said that the NSLVE team appreciates the opportunity to engage with campuses directly about how to make the report more responsive to specific institutions.
“We’re always grateful when campuses reach out and just ask questions about their data,” Brinker said. “We have over a thousand campuses in the study, so we don’t tailor our process to any particular institutional profile. So our ability to monitor the data quality at each institution is limited, and that’s why we really depend on campuses contacting us.”
Peacock says that he hopes to continue working with Brinker and other NSLVE researchers ahead of the 2020 election to help the report become more accurate in the future.
“We plan to continue to work together and may participate in some test runs after the 2020 election if they are ready to do that,” he wrote in a follow-up email to the Review. “Zeb and I expressed our gratitude that they have started this effort, understand how there can be some bugs, and both NSLVE and Oberlin look forward to our continued partnership.”
For his part, Page hopes that his ongoing research will encourage Oberlin students to vote.
“[If] people are discouraged from voting because they believe people at Oberlin don’t vote and aren’t really engaged, then that’s a positive feedback loop that is rooted in something that I don’t believe to be true,” he said. “I think it’s important to recognize that perhaps the story of engagement is not being told correctly in a lot of spheres, that it’s in particular not being told correctly about Oberlin.”


